Main Effects & Interaction Effects Explained
Do you like chocolate sauce?
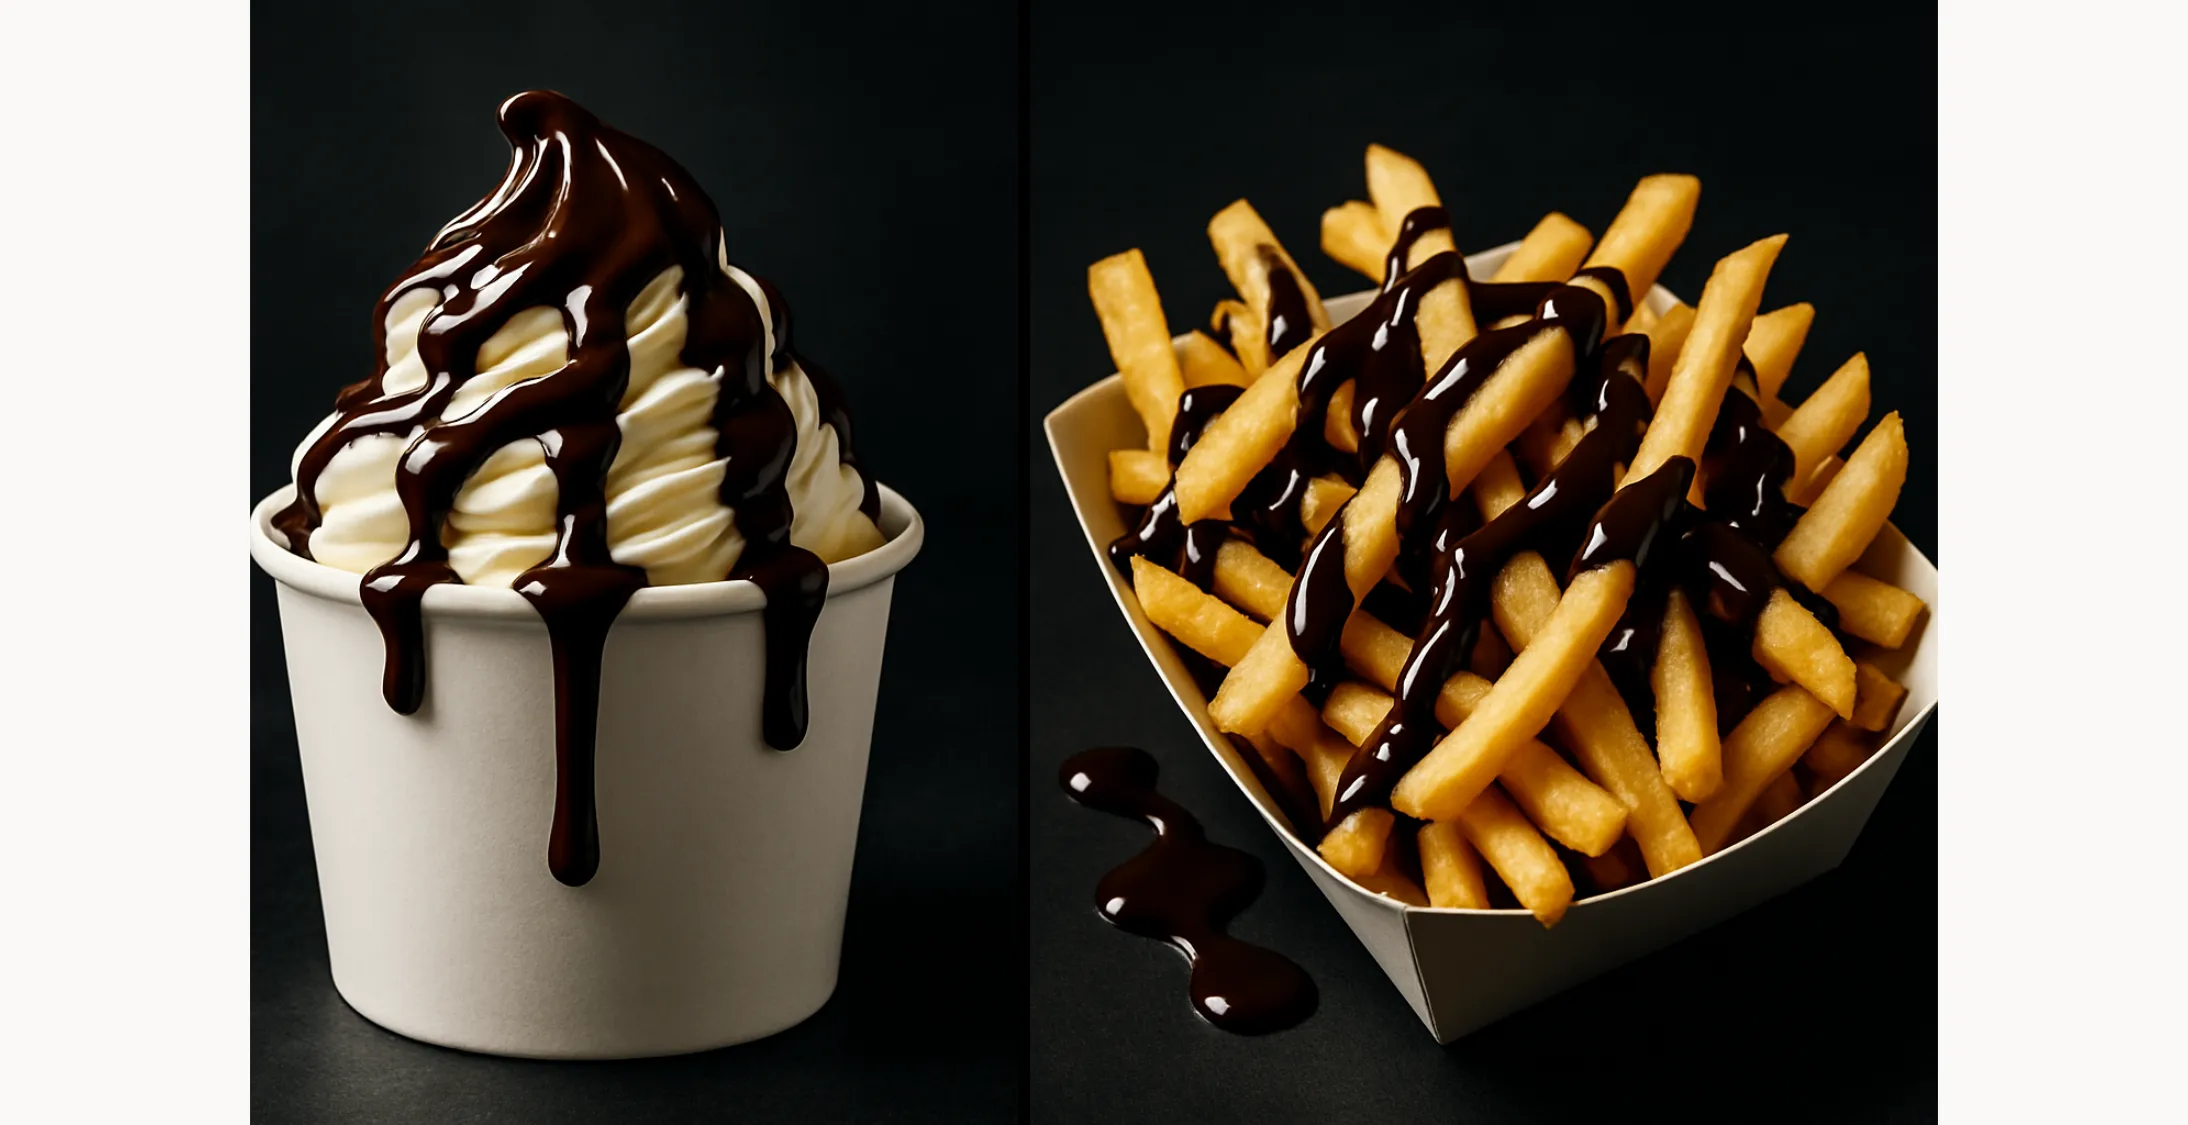
That’s a weird question to ask on a website about experimental design, isn’t it? But imagine a waiter asking you if you’d like chocolate sauce with what you ordered. You’d probably say yes - most people like chocolate sauce. But I’d say: It depends on what you ordered. If it’s ice cream? Sure, chocolate sauce is nice. If it’s French fries? Unless you’re from Belgium… probably not (no offense to our Belgian readers - your fries are legendary).
So what does this have to do with experiments?
The chocolate sauce is a factor you’re testing. The dish — ice cream or French fries — is another factor. Now suppose you’re testing whether chocolate sauce increases customer satisfaction. You’d run an experiment with and without chocolate sauce, across the different dishes, and measure people’s enjoyment.
If chocolate sauce always makes the dish better, regardless of what it is, then you’re seeing a main effect — chocolate sauce has a consistently positive impact, independent of what you are combining it with. But if it boosts enjoyment with ice cream and ruins it with fries, that’s an interaction. The effect of the chocolate sauce depends on what it’s paired with.
In other words: the impact of one factor (chocolate sauce) depends on the level of another (the dish).
Interactions are a big deal
You don’t want to miss interactions between two factors. They happen often and are usually important — just like in our example above.
Higher-order interactions — between three or four factors — usually don’t matter that much. I mean, it’s not going to make a difference if you also sprinkle chocolate chips onto your fries with chocolate sauce.
Let’s get technical again
Below are results from a chemical filtration experiment. We tested the effects of temperature, pressure, and solvent concentration on filtration rate.
| Temperature / °C | Pressure / bar | Concentration / % | Filtration rate / L·min⁻¹ |
|---|---|---|---|
| 25 | 1 | 0 | 2.8 |
| 50 | 1 | 0 | 6.3 |
| 25 | 5 | 0 | 2.8 |
| 50 | 5 | 0 | 4.1 |
| 25 | 1 | 50 | 4.7 |
| 50 | 1 | 50 | 3.8 |
| 25 | 5 | 50 | 5.1 |
| 50 | 5 | 50 | 6.1 |
Visualizing and interpreting interactions
To spot interactions, we can use interaction plots—put one factor on the x-axis and use color to show levels of another.
On the left, we plot temperature vs. pressure. On the right, we plot temperature vs. solvent concentration.
We could also plot pressure vs. solvent concentration, but let’s skip that for now.
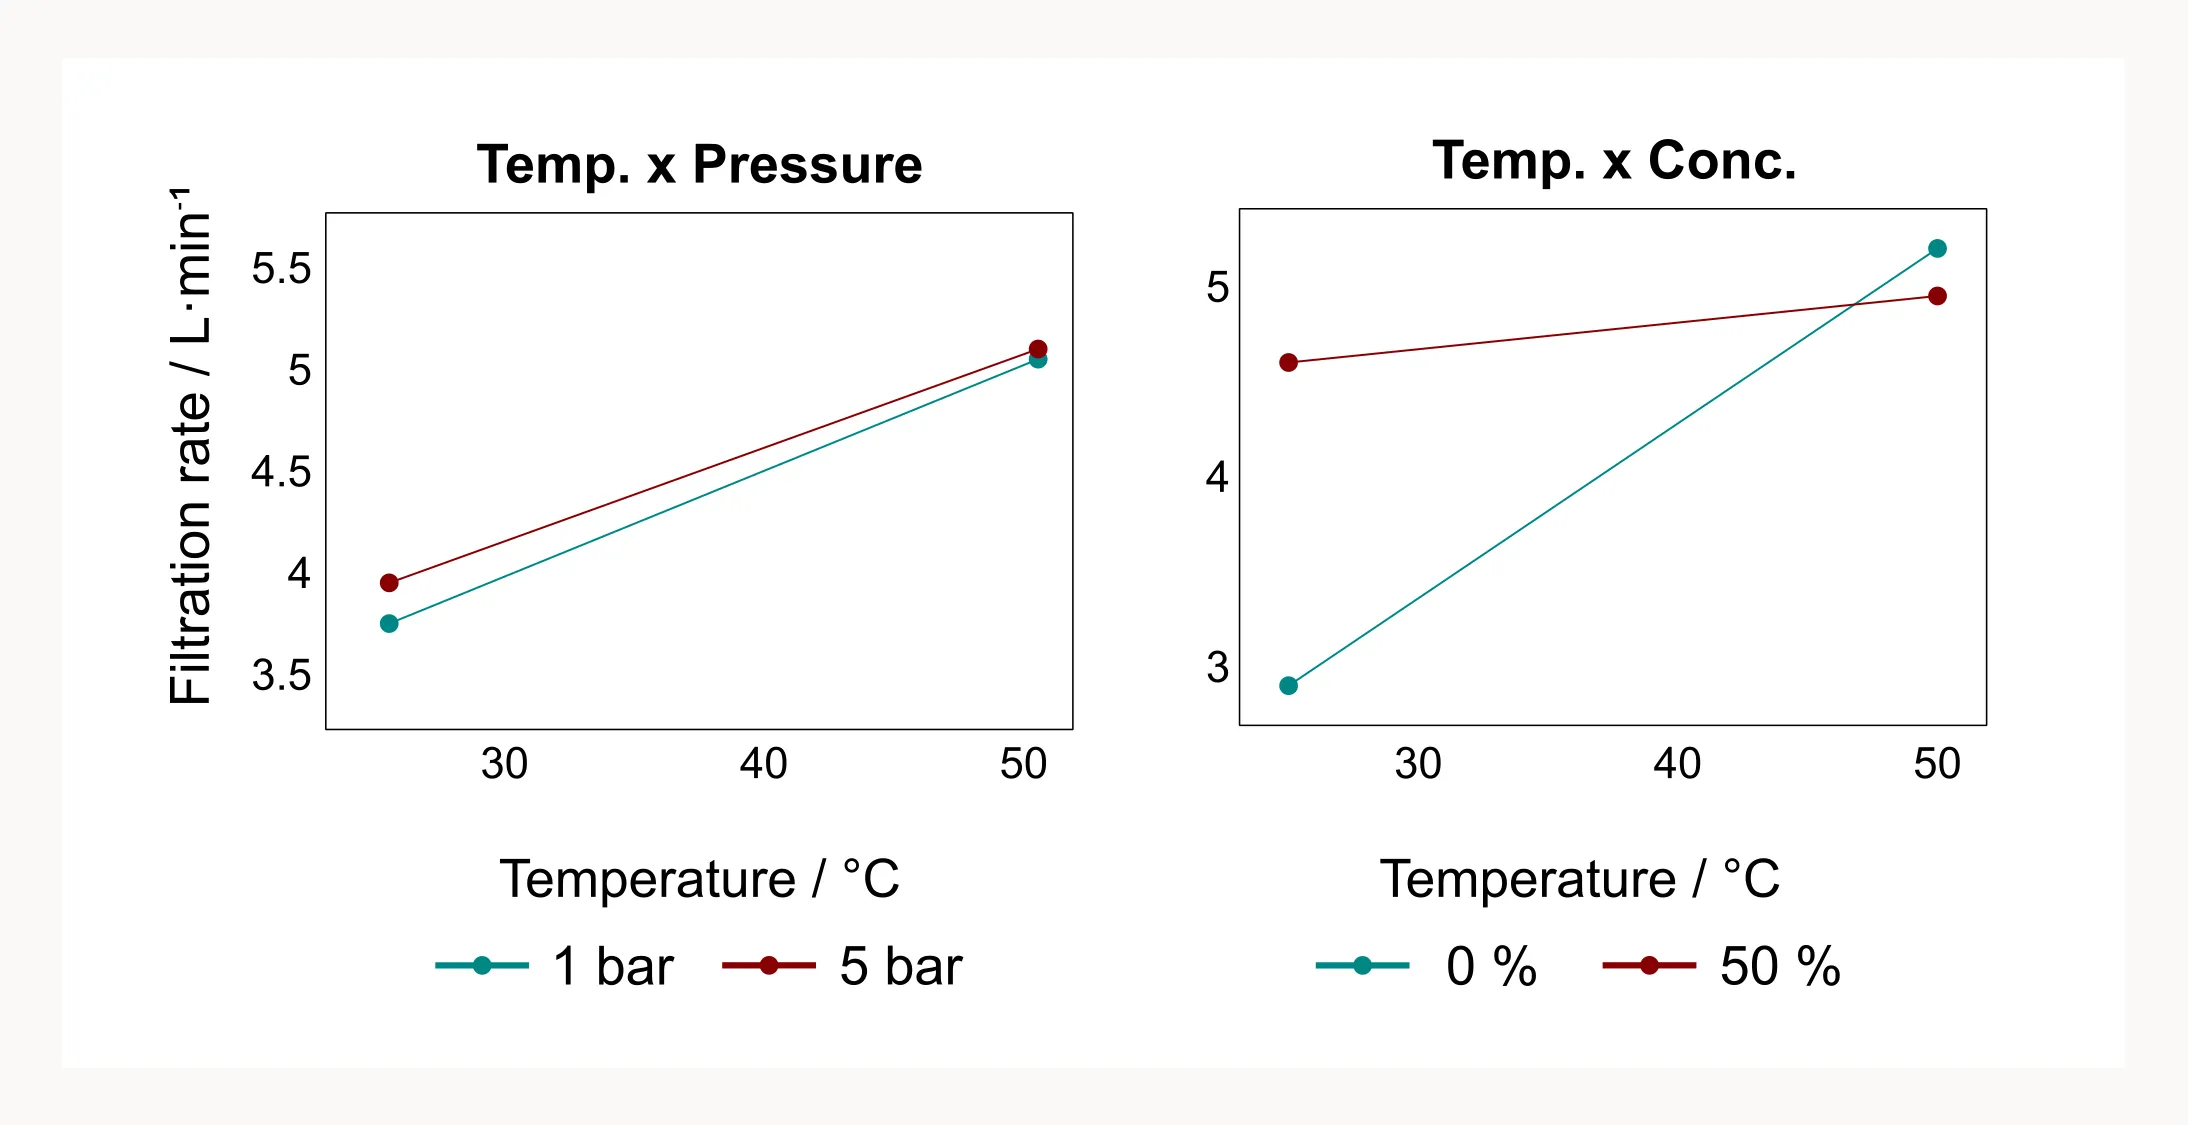
In the left plot, the lines are parallel—meaning no interaction. Temperature increases filtration rate regardless of pressure. Their effects are independent. In the right plot, the lines are not parallel. That means interaction! At low solvent concentration, increasing temperature helps to increase the filtration rate. At high concentration, it doesn’t. So the effect of temperature depends on solvent concentration.
Visualizing and interpreting main effects
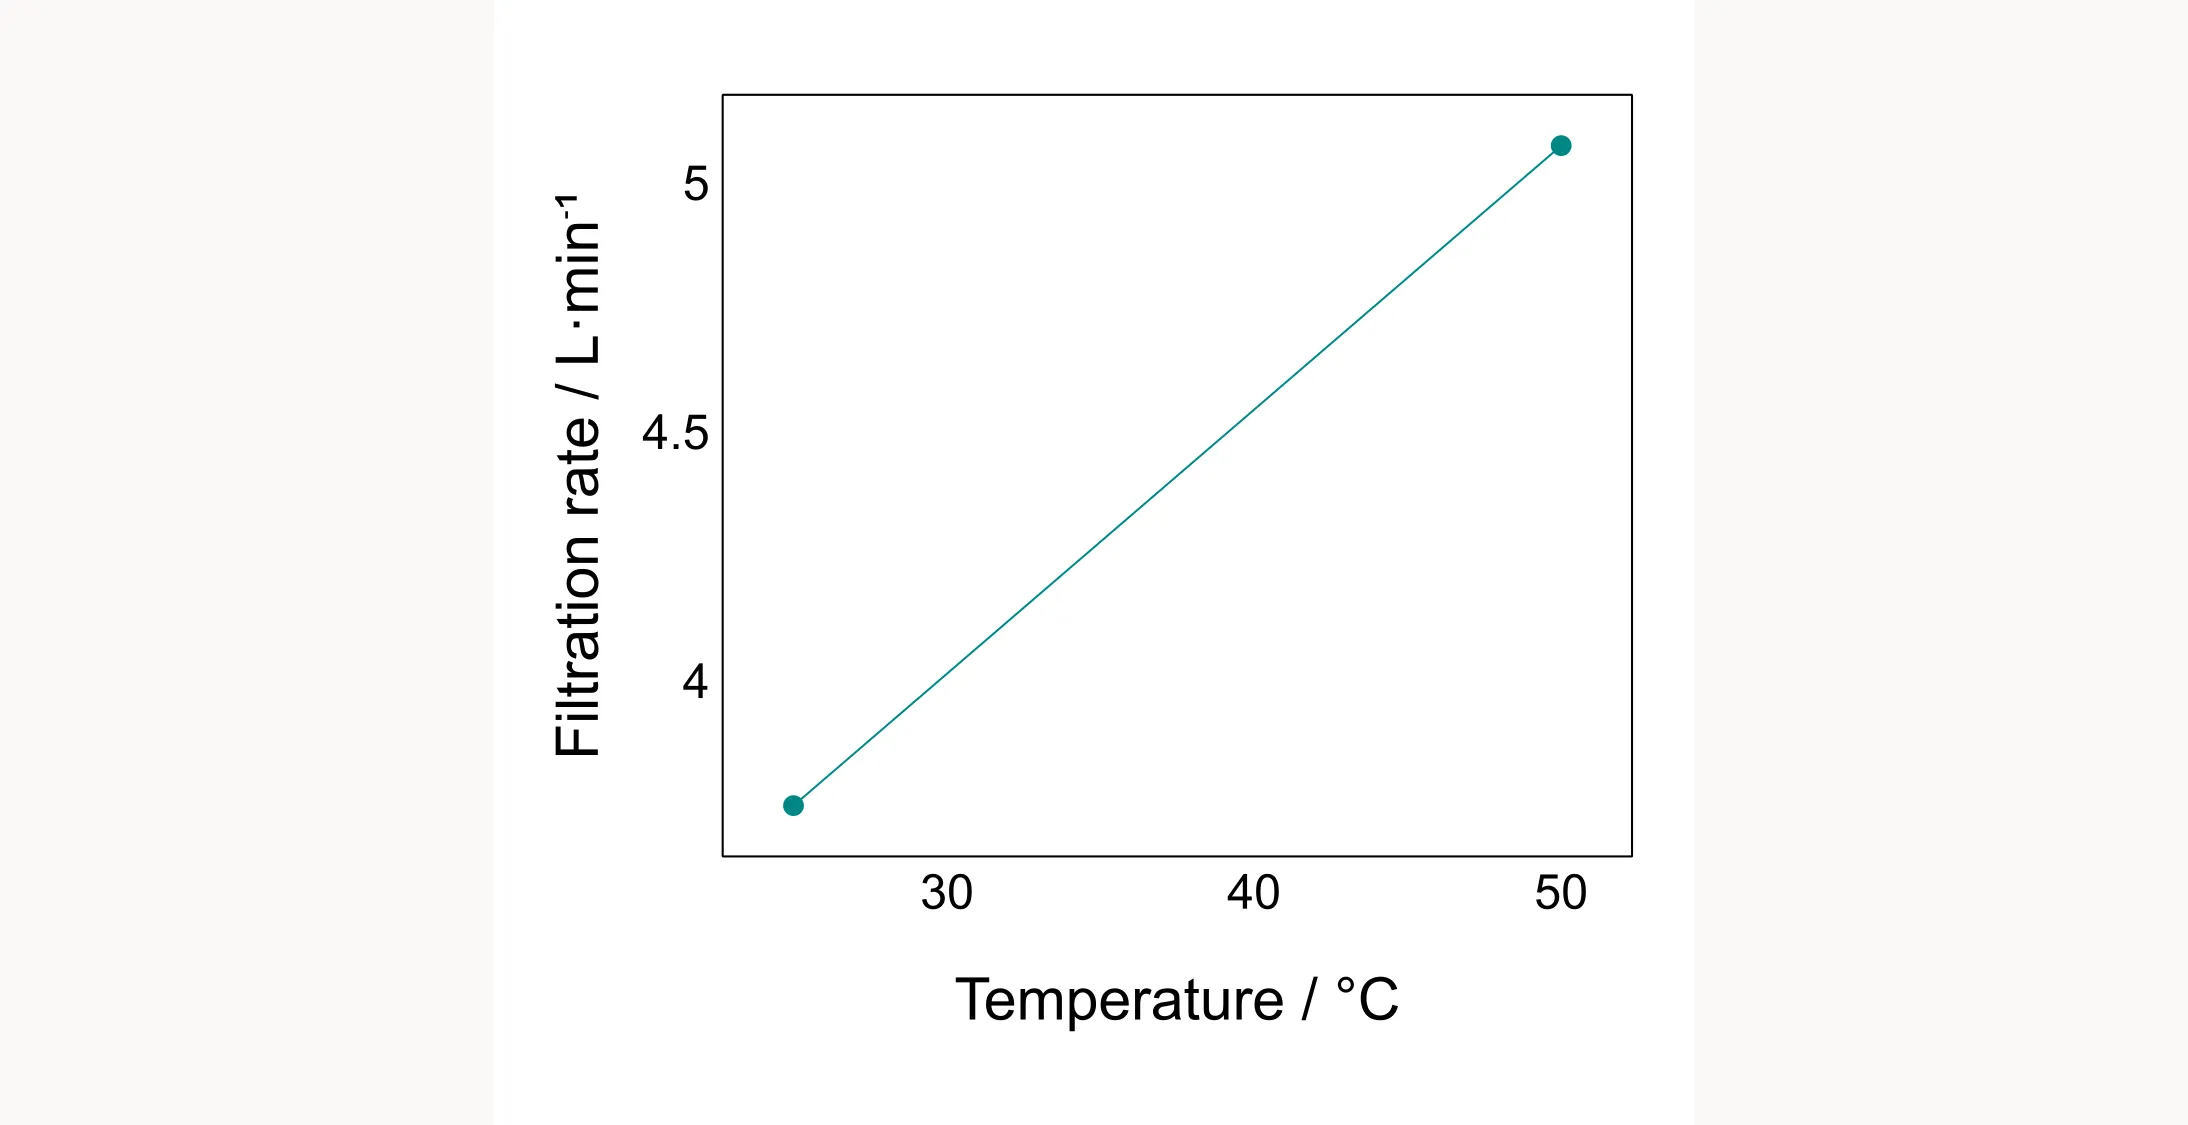
A main effect shows the average impact of a factor—averaged across all other conditions. But if there’s a strong interaction hiding underneath, the main effects can be misleading. Take temperature, for example. The main effect plot below suggests that higher temperature always increases filtration rate.
But as we just saw in the interaction plot, that’s not true when solvent concentration is high.
What are main effects good for then?
Good question. Yes, it’s usually risky to interpret main effects in isolation — but under the right circumstances, it can actually make sense.
The majority of experimental runs are needed to resolve interactions between factors. Or in other words, you can save significant time and effort when you only focus on main effects. And in the early stages of a project, when you’re still trying to figure out which factors even matter, it’s often not practical — or necessary — to dive deep into interactions just yet.
Therefore, certain screening design plans (and we’ll discuss them in more detail in one of the next chapters) are used to identify the most important factors using relatively few experiments. They focus primarily on main effects and only provide limited information about interactions. But that’s okay — the goal at this stage is to narrow things down.
One commonly used screening design is the Plackett-Burman design. It doesn’t capture interactions in detail, but it gives you enough insight to decide which factors are worth studying further. And here’s the key part: even though you’re not explicitly modeling interactions, main effects and interactions are still connected. So you can still get a sense of whether interactions are likely to be important.
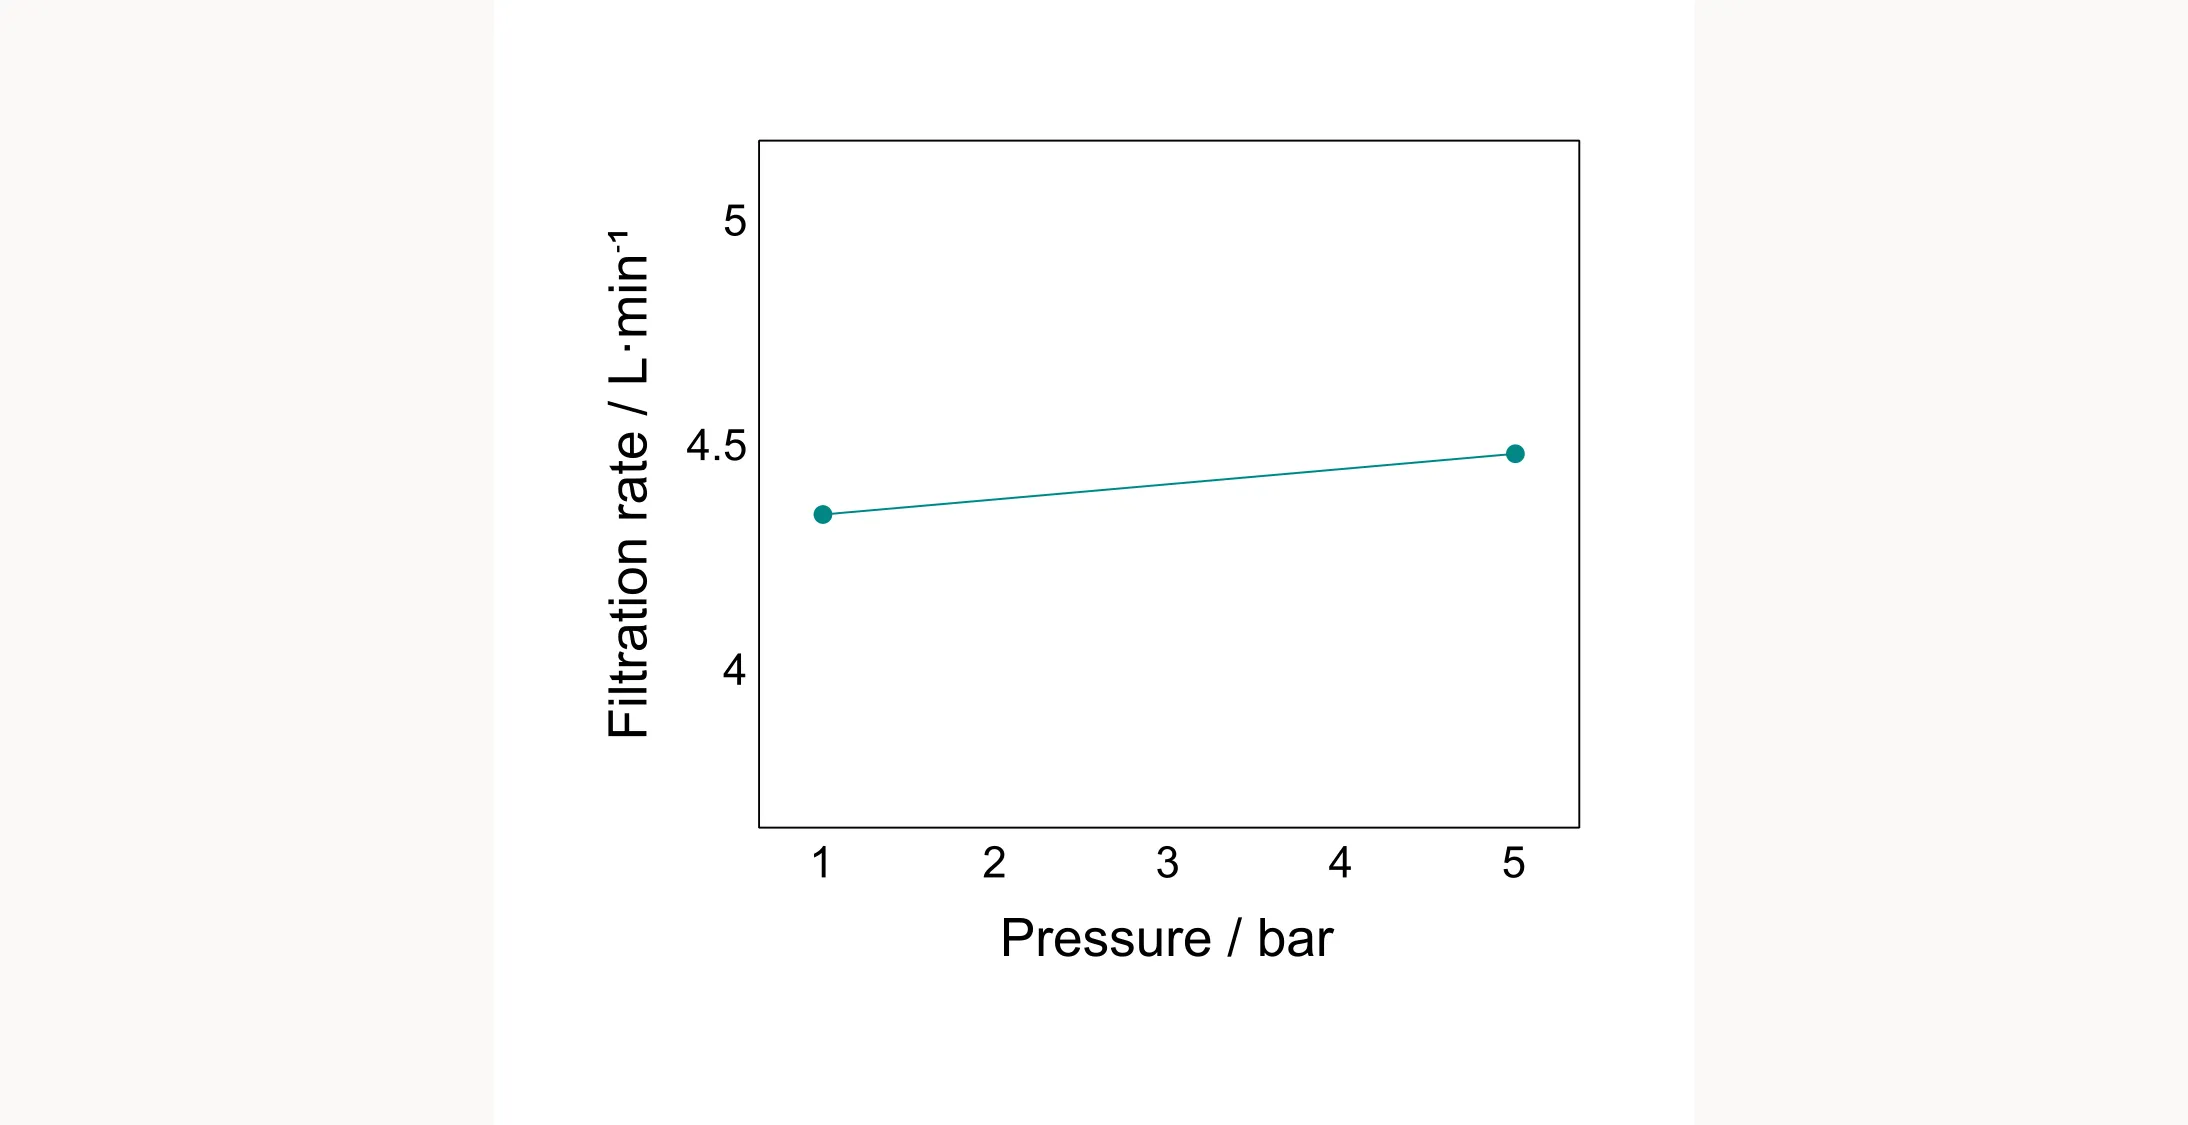
Take the plot above as an example. It shows the main effect of pressure. The isolated effect of pressure on filtration rate is small — and, as we saw earlier, the interaction between pressure and temperature is also small. That’s often how it goes: when the main effect is weak, the interactions involving that factor are also weak.
Bottom line
Chocolate sauce is delicious—just not on everything. And while understanding interactions is important, it is okay to neglect them (at least in parts) for screening experiments.
But to understand interactions when the time comes, we’ll need to understand some basic design principles. Because with the all-too-common and unfortunately very intuitive one-factor-at-a-time (OFAT) method, you won’t see any interactions at all… which brings us to the classic OFAT debate.