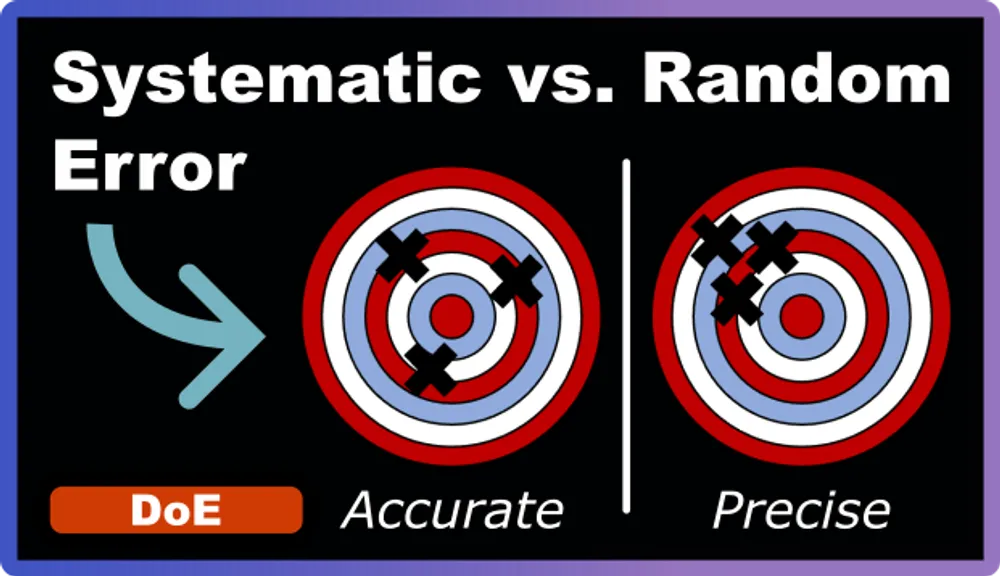
Understanding Systematic and Random Errors
In Design of Experiments (DoE), we structure our experiments to extract maximum information from minimal trials. However, without proper error management, even the most sophisticated experimental design can lead to unreliable results.
This article will help you recognize the two main types of errors (systematic and random) and give you practical strategies to deal with them. You’ll also learn how these concepts connect to the fundamental DoE principles that ensure your experimental conclusions are reliable.
Types of Errors
Every measurement you take in an experiment contains some level of error. The key is understanding what type of error you’re dealing with, because the strategies for managing them are different.
Random Errors: The Unavoidable Variability
Random errors are the unpredictable fluctuations that occur in every measurement, no matter how careful you are. Think of them as the natural variability in your experimental system.
Common sources of random errors:
- Minor fluctuations in environmental conditions (temperature, humidity, air pressure)
- Variations in measurement instruments
- Small differences in how procedures are executed each time
- Natural variability in your experimental materials or subjects
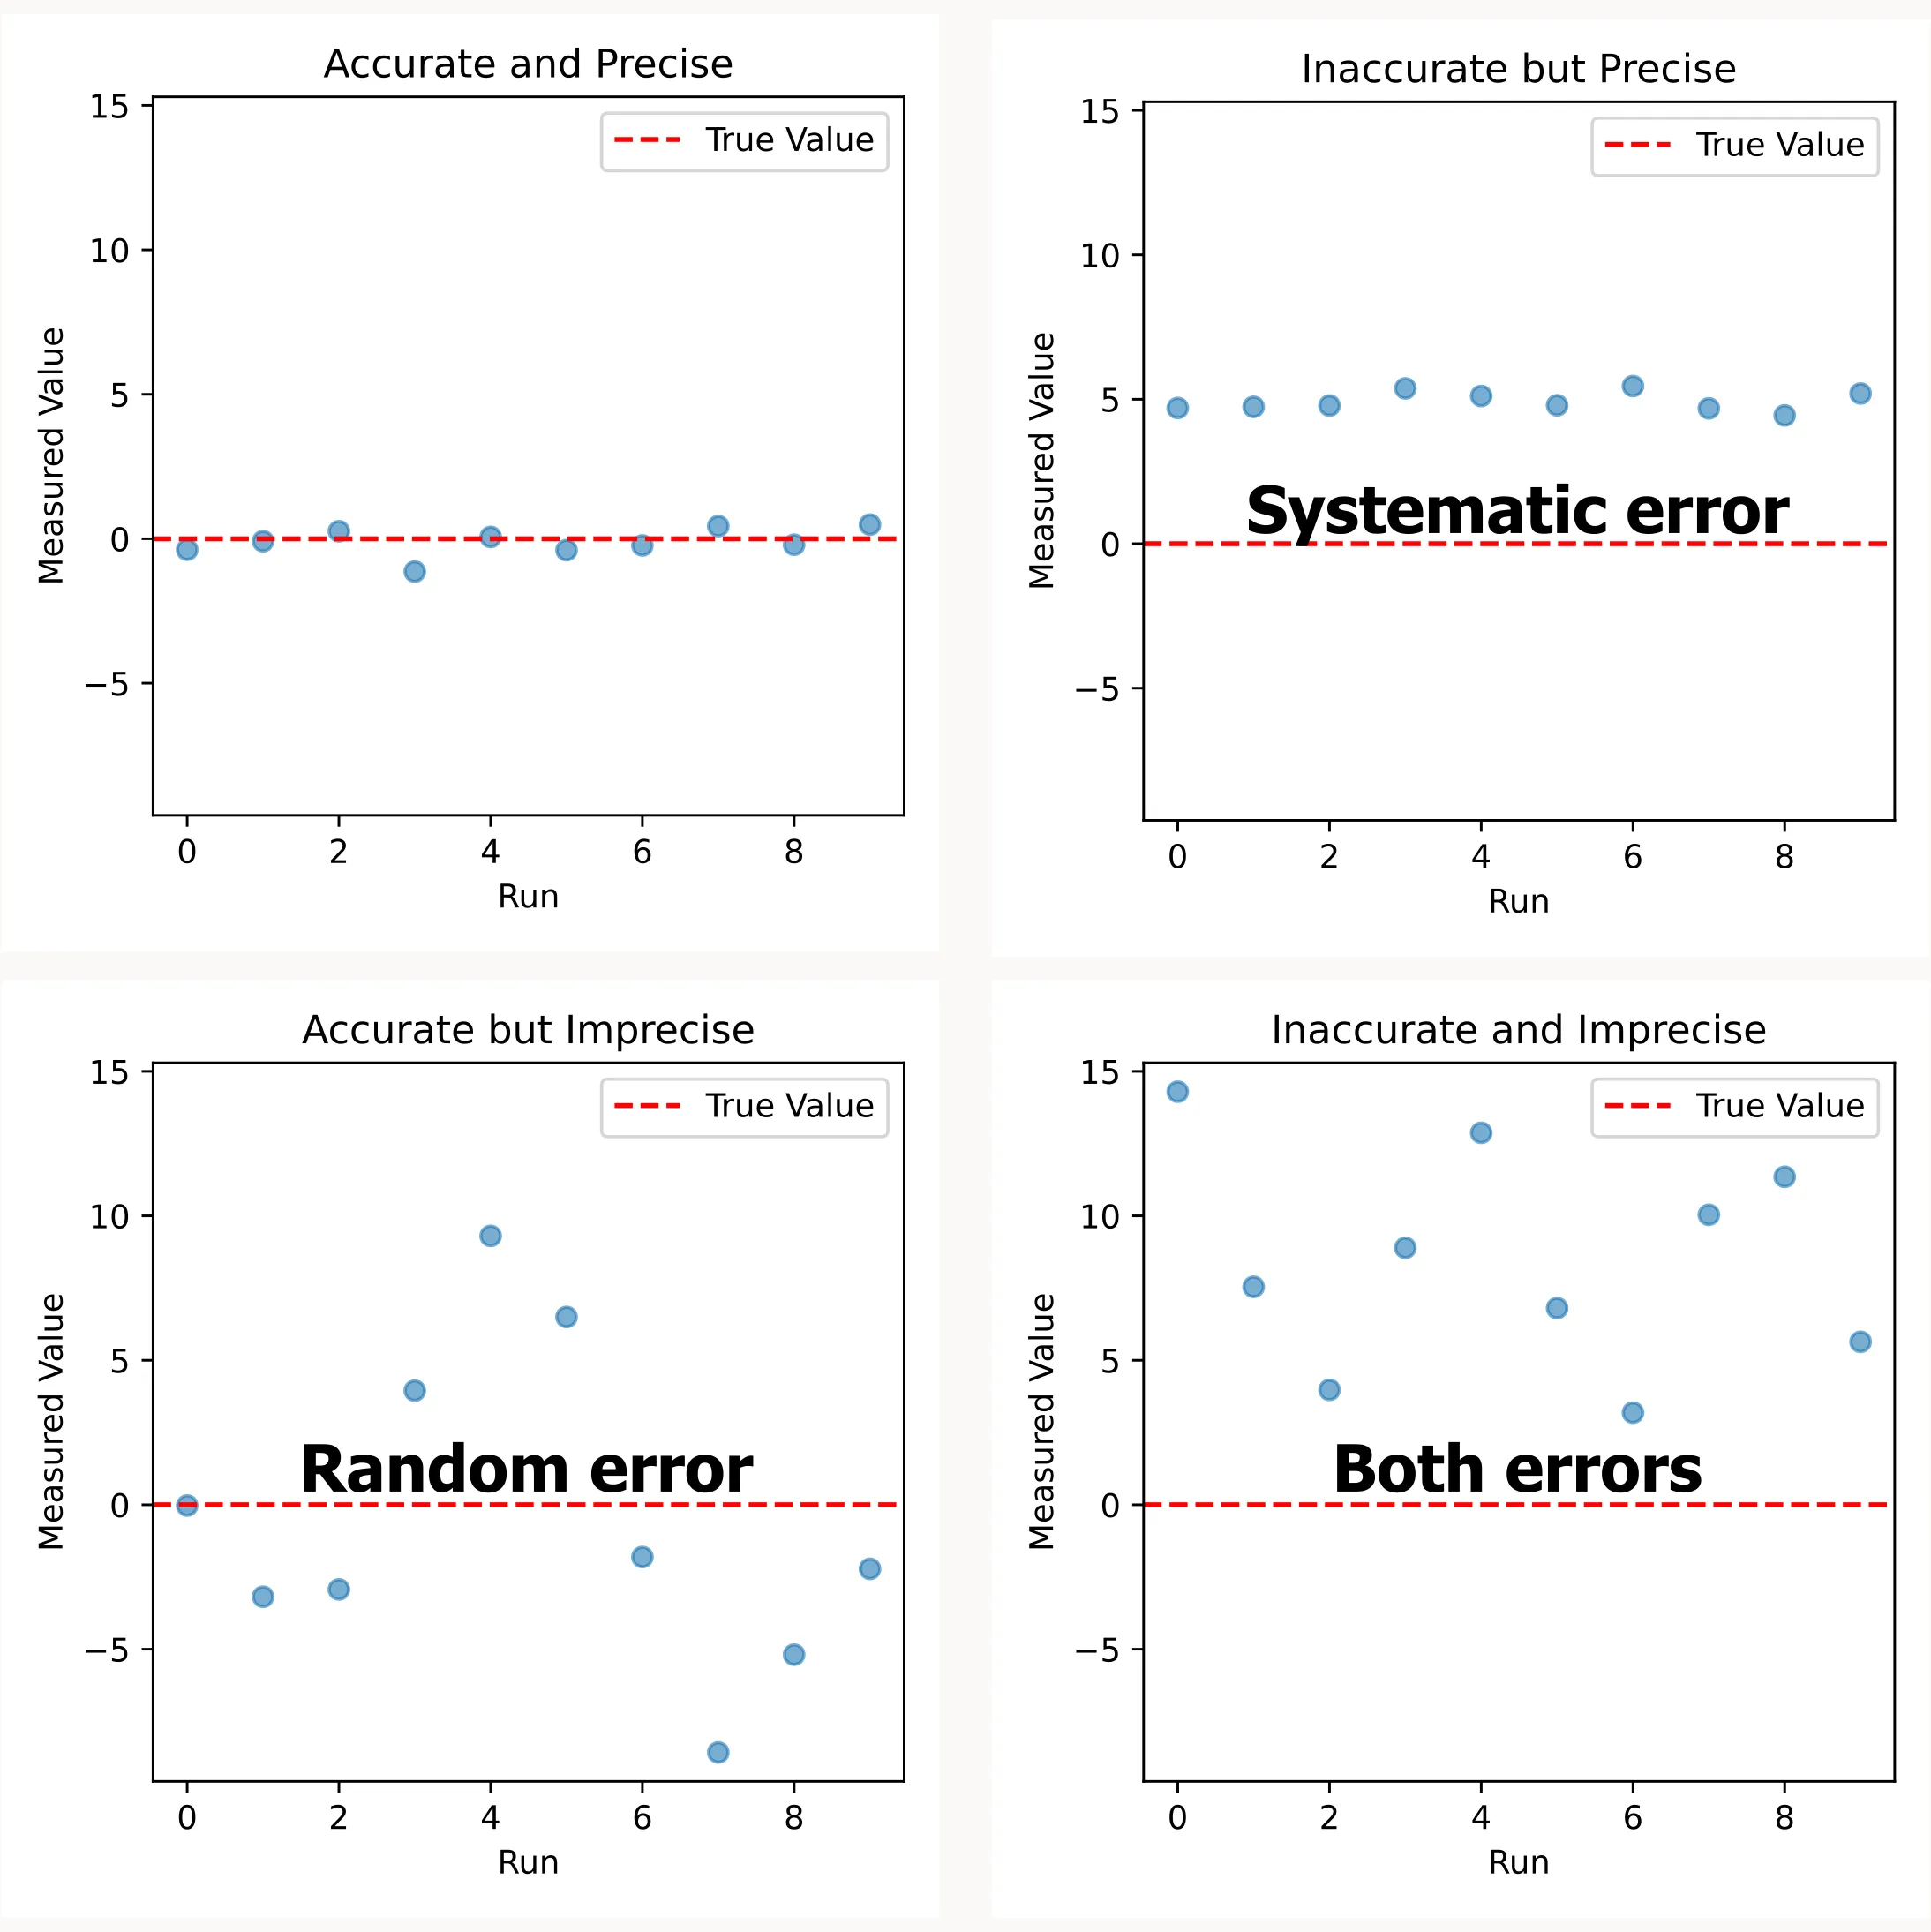
Consider measuring the yield of a chemical reaction at 150°C. Even with precise temperature control, you might get yields of 94.2%, 95.1%, and 94.8% across three identical runs. That spread around 95% is random error. It’s the inherent variability in your system.
The impact of random errors: They primarily affect precision (how reproducible your results are) rather than accuracy (how close you are to the true value). Random errors make your data more scattered, but they don’t consistently push your results in one direction.
Systematic Errors: The Silent Bias
Systematic errors are more insidious. They consistently bias your results in the same direction, creating a false sense of precision while leading you to the wrong conclusions.
Common sources of systematic errors:
- Calibration issues: An instrument that consistently reads 2°C too high
- Procedural bias: Always measuring samples from the same location in a reactor
- Environmental bias: Performing experiments at different times of day without accounting for temperature variations
- Material inconsistency: Using different batches of reagents without tracking the difference
Returning to our chemical reaction example: if your thermometer consistently reads 2°C low, you might think you’re running reactions at 150°C when you’re actually at 152°C. Your three measurements might be very precise (152.1%, 152.3%, 152.0%) but systematically incorrect.
The impact of systematic errors: They primarily affect accuracy while potentially maintaining good precision. This makes them dangerous. Your data looks consistent, but your conclusions are biased.
Real-World Error Management: A Coating System Example
To see how this works in practice, consider studying factors that affect the pot life of a coating system (the time you have to use mixed coating material before it hardens and becomes unusable).
Identifying Potential Error Sources
Random error sources:
- Environmental fluctuations: Small changes in ambient temperature or humidity during testing
- Measurement precision: Minor variations in timing when determining the end of pot life
- Material preparation: Slight differences in mixing speed or duration between batches
- Operator variability: Different technicians may interpret the endpoint differently
Systematic error sources:
- Calibration drift: If your viscometer isn’t calibrated regularly, it might consistently under or overestimate viscosity changes
- Procedural bias: Always taking samples from the same location in the mixing container
- Temporal effects: Running all tests for one formulation in the morning and another in the afternoon when temperatures are different
- Batch effects: Using different lots of hardener that have slightly different reactivities
Error Management Strategy
DoE offers more than just efficient experimental design. It includes built-in strategies for dealing with these errors. There’s a fundamental principle that guides us: “Block what you can, randomize what you can’t.”
Blocking helps control known sources of variability. If you know that different batches of hardener behave differently, group your experiments by batch and account for this in your analysis. This prevents batch-to-batch variation from confounding your main results.
Randomization protects against unknown or uncontrollable sources of bias. By running your experiments in random order, you spread the effects of any lurking variables (like temperature changes throughout the day) evenly across all your treatments.
Replication allows you to quantify random error and increases the reliability of your conclusions. By repeating key experimental conditions, you can distinguish between real effects and random noise.
These three principles (blocking, randomization, and replication) are the foundation of robust experimental design. They’re covered in detail in our Principles of DoE guide.
Beyond Error Prevention: Detection and Diagnosis
Even with the best error management practices, you need tools to detect when errors are affecting your results. Residual analysis provides exactly this capability.
Residuals (the differences between observed and predicted values) provide a window into error patterns:
- Random scatter in residual plots suggests your error management is working
- Trends or patterns in residuals reveal systematic issues that need attention
- Outliers in residual plots highlight measurements that warrant investigation
When you build models from your experimental data, residual analysis helps you validate whether your conclusions are trustworthy or if errors are biasing your results.