Why Blocking Matters
We’ve talked about blocking as one of the three fundamental principles of DoE before. In theory, it makes sense: group your experiments by known sources of variability to keep them from confounding your results. But theory is one thing. Seeing what happens when you don’t use blocking is another.
This post walks through a real experiment where we didn’t block, and it came back to bite us. Fortunately it was obvious enough so that we caught it. But that’s not necessarly always the case.
The Experiment: Testing Reactive Diluents in Epoxy Coatings
We were investigating how adding a reactive diluent affects the pot life of an epoxy coating. Pot life is the time the mixed epoxy remains workable before it starts to harden—critical for application processes.
The setup was straightforward:
- One epoxy base resin
- Two different hardeners: Hardener 1 (slow-reacting) and Hardener 2 (fast-reacting)
- Varying concentrations of reactive diluent
- Response variable: Pot life (in minutes)
We expected to see how the diluent concentration influenced pot life for each hardener type. We already knew that in general it reduced reactivity thus increasing the pot life.
What the Data Showed
When we analyzed the results, we got three key plots: main effects for hardener, main effects for diluent concentration, and an interaction plot.
Main Effect of Hardener
The left plot below shows that Hardener 2 reacts significantly faster than Hardener 1, giving a much shorter pot life of around 20 minutes compared to over 160 minutes. No surprises there. That’s exactly what we intended.
Main Effect of Reactive Diluent Concentration
The middle plot was where things got strange. It suggested that increasing the diluent concentration from 13% to 17% decreased the overall pot life from about 100 minutes down to about 70 minutes. That didn’t make sense. How could adding more diluent reduce the working time? It was the opposite of what we expected.
Interaction Plot: The Real Story
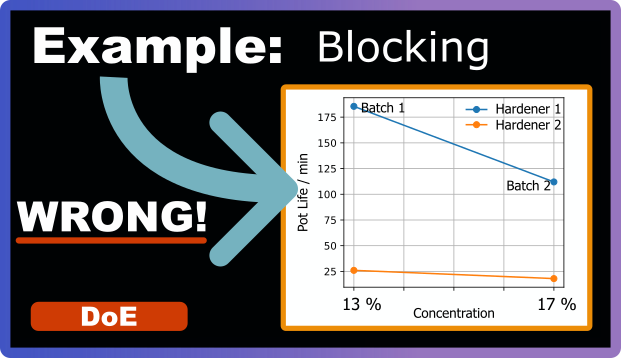
The interaction plot on the right revealed what was actually going on. For Hardener 2 (orange line, same batch for both measurements), pot life stays relatively constant at around 20-25 minutes regardless of diluent concentration. Exactly what you’d expect. But for Hardener 1 (blue line), there’s a dramatic drop from about 185 minutes at 13% concentration down to about 110 minutes at 17% concentration.
Here’s the critical detail visible in the plot: the two data points for Hardener 1 came from different batches (Batch 1 and Batch 2).

What Went Wrong?
After some investigation, we discovered the problem: different batches of Hardener 1 had different reactivities due to a production error. Batch 2 reacted faster than Batch 1. By not grouping our experiments by batch number, we let this batch-to-batch variability contaminate our results. The experiments with higher diluent concentrations happened to use the more reactive batches. So the lower pot life wasn’t caused by the diluent at all—it was caused by the batch-to-batch differences we failed to control for.
Why This Matters
We got lucky. This was a relatively simple experiment with only a few factors, and the strange result was obvious enough that we investigated further. In a larger, more complex design with many factors and levels, this kind of error might have gone completely unnoticed. We might have drawn false conclusions about the diluent’s effect and wasted time optimizing based on faulty data.
This is exactly what blocking is supposed to prevent. When you have known sources of variability (like different batches, different machines, different operators, different days) you group your experiments accordingly and account for these blocks during analysis. That way, you can separate the block effects from the factor effects you actually care about.
Best case: You block by batch (or machine, or operator, or day), and the analysis shows no significant difference between blocks. Great! The blocking didn’t hurt anything, and you’ve confirmed that your materials or conditions were consistent.
Worst case: You block and discover significant differences between blocks, just like we would have in this experiment. Now you know something’s wrong. You can investigate, fix the problem, and rerun the experiment with better control. You haven’t wasted weeks drawing conclusions from confounded data.
How to Implement Blocking
Blocking is often easy to incorporate, especially with fractional factorial designs. You can add it as an additional variable without having to add a lot of extra runs. The design structure handles it efficiently.
When planning your experiments, ask yourself:
- Are there different batches of materials involved?
- Will experiments be run on different days or by different operators?
- Are multiple machines or pieces of equipment being used?
- Are there environmental conditions (temperature, humidity) that might vary?
If the answer to any of these is yes, consider blocking. It costs you almost nothing in terms of experimental effort, but it can save you from drawing completely wrong conclusions.
By the way, keeping any of these factors constant is also a form of blocking. If you think batches differ, use the same batch for all experiments if you can. Only if you can’t keep them constant, then add a block variable to your design.