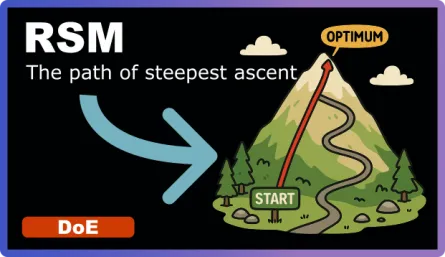
The Path of Steepest Ascent
Learn how to use the path of steepest ascent to optimize processes systematically. Includes practical examples for linear models with and without interactions.
Read More Learn how to use the path of steepest ascent to optimize processes systematically. Includes practical examples for linear models with and without interactions.
Read More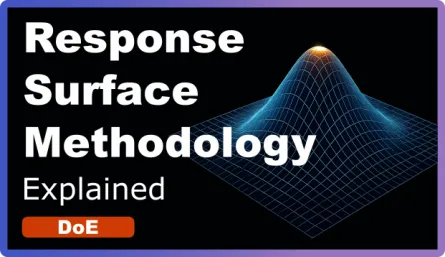
Learn how Response Surface Methodology uses sequential experiments and polynomial models to navigate the optimization landscape and find better process conditions step by step.
Read More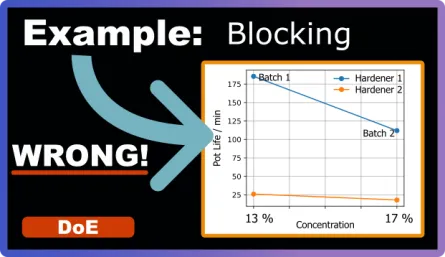
A real-world example showing what happens when you skip blocking in your DoE. Learn from this epoxy coating experiment how batch-to-batch variability can confound your results—and how blocking prevents it.
Read More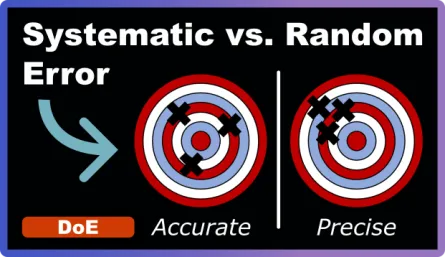
Learn to identify, understand, and manage systematic and random errors in experimental design. Discover how these errors impact accuracy and precision, and master the strategies to minimize their effects on your DoE results.
Read More
Learn to create efficient Box-Behnken designs using pyDOE3: a practical guide for optimizing processes with fewer experiments while exploring quadratic effects and curvature.
Read More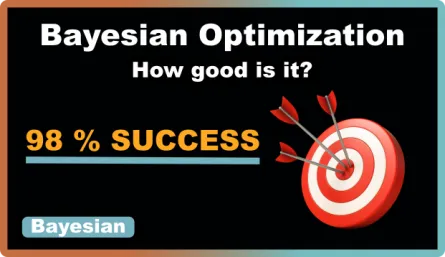
Comparing Bayesian Optimization against random sampling and fractional factorial design using real lab data. Learn how BayBE achieves 98% success rate vs 50% for random approaches in optimizing coating hardness.
Read More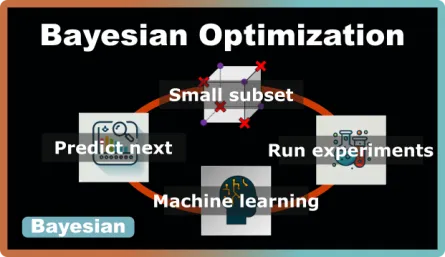
Discover how Bayesian Optimization revolutionizes experimental design by using machine learning to intelligently guide experiments, saving time and resources compared to traditional DoE methods.
Read More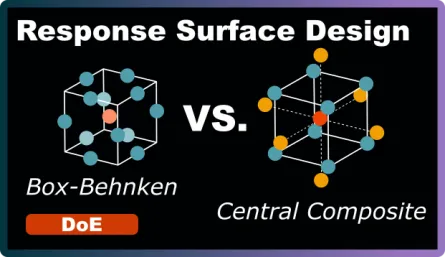
Learn the key differences between Central Composite and Box-Behnken designs, and discover which response surface design is best for your optimization experiments.
Read More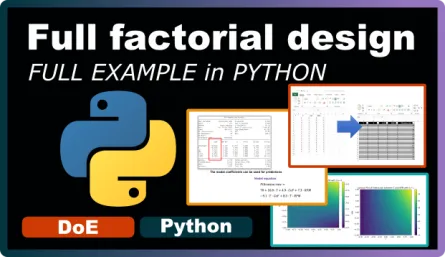
A comprehensive step-by-step guide to implementing 2-level full factorial designs using Python. Learn to create experimental plans, visualize main effects and interactions, perform ANOVA, conduct model diagnostics, and generate 3D surface plots - all with practical code examples and real filtration rate data.
Read More